
Brooklyn cut Prospect Park West from three traffic lanes to two and added a protected bike path; speeding fell from 74% of vehicles to 20%, while injury crashes fell 63%


In June 2010, Brooklyn changed one of its busiest park-edge avenues. Prospect Park West , which runs alongside Prospect Park in Park Slope , went from three moving lanes to two and the free space became a two-way protected bicycle path with a 3-foot parking lane buffer. The New York City Department of Transportation (NYC DOT) tracked what happened next and presented the results to Community Board 6 in January 2011 in the Prospect Park West Bicycle Path and Traffic Calming Update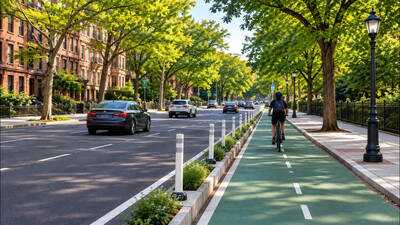 . Two figures from NYC DOT’s January 2011 presentation travel widely: speeding fell from 74% of vehicles to 20% and injury crashes fell by 63%. Both come from narrow measurement windows.
Speeding fell from 74% to 20% on one block
The speed figures come from NYC DOT radar readings on the block between 5th and 6th Streets, so they do not represent speeds for all vehicles on the avenue. Before the redesign, an average of 74% of vehicles on that block exceeded 30 mph, or roughly three in four. The average row in the update put the share of vehicles over 30 mph at 20% after the redesign, with average speed dropping from 33.8 mph to 26.6 mph. There was a discrepancy between the two sets of ‘after’ data; however, at the morning peak hour, the figure was 11% in July and 22% in October, while in the evening, it went from 23% to 14%.
Injury crashes from 5.3 to 2 per six months
The crash data came from NYPD records for the stretch between Grand Army Plaza and Bartel Pritchard Square, as cited in the update. The comparison set the July to December average of 2007, 2008 and 2009 against a single period, July to December 2010. Total crashes were down 16% and crashes that caused injuries were down 63%. A January 2012 NYC DOT presentation for a Transportation Research Board workshop showed the raw numbers: an average of 5.3 injury crashes per six months before the project and 2 after. It’s quite a low base when compared to just six months; hence the percentage seems to be higher when compared to the actual reduction in accidents.
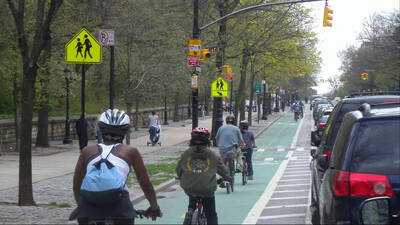 The above-mentioned study adds that injuries to all street users fell 21%. The study further indicates that prior to the intervention, an accident was twice as likely to contain an injury (18% vs 8%). NYPD did not report any injuries sustained by pedestrians after the intervention.
Traffic held steady while weekday cycling nearly tripled
The removal of one lane didn’t create any bottlenecks on the avenue. Peak-hour traffic counted on Prospect Park West at Carroll Street rose 5% in the morning (from 1,055 to 1,109 vehicles) and 2% in the evening (from 991 to 1,010 vehicles), the same pattern recorded. Weekday commute times remained the same; vehicle and cyclist counts indicated an increase of 13% in the morning and 9% in the evening. The situation was much different when it came to cycling. Weekday cycling between 3rd and 5th Streets rose 190%, but that figure came from comparing the average of four counts taken from August to November 2010 with a single count from June 2009. Sidewalk cycling volume decreased from 46% to 3%.
Citywide data gives context, not a second count
Making Safer Streets, a separate report from the same agency, published in November 2013, compared crash data before and after street projects completed over seven years. There were drops in injury crashes, ranging between 12% and 88% for different streets with different designs based on three years of before data versus two to three years of after data. Among the projects listed, Bowne Street in Queens, which saw a three-to-two-lane design and safety islands for pedestrians, saw a 23% reduction in injury crashes. Prospect Park West is not in this list, thus making this report an excellent context for the park, rather than an analysis for the project. On having fewer lanes, the report argues that a street with many vague lanes may be congested by vehicles, engaging in double parking and turning movements in the lanes intended for through movement, hence the need to give the movement its place. On cycling, the report noted a 72% drop since 2000 in the average risk of serious injury to cyclists in the city, while bike trips nearly tripled. The report added that the biggest crash reductions generally came where redesigns were most extensive and problems were worst.
Speeding fell from 74% to 20% on one block
The speed figures come from NYC DOT radar readings on the block between 5th and 6th Streets, so they do not represent speeds for all vehicles on the avenue. Before the redesign, an average of 74% of vehicles on that block exceeded 30 mph, or roughly three in four. The average row in the update put the share of vehicles over 30 mph at 20% after the redesign, with average speed dropping from 33.8 mph to 26.6 mph. There was a discrepancy between the two sets of ‘after’ data; however, at the morning peak hour, the figure was 11% in July and 22% in October, while in the evening, it went from 23% to 14%.
Injury crashes from 5.3 to 2 per six months
The crash data came from NYPD records for the stretch between Grand Army Plaza and Bartel Pritchard Square, as cited in the update. The comparison set the July to December average of 2007, 2008 and 2009 against a single period, July to December 2010. Total crashes were down 16% and crashes that caused injuries were down 63%. A January 2012 NYC DOT presentation for a Transportation Research Board workshop showed the raw numbers: an average of 5.3 injury crashes per six months before the project and 2 after. It’s quite a low base when compared to just six months; hence the percentage seems to be higher when compared to the actual reduction in accidents.
Traffic held steady while weekday cycling nearly tripled
The removal of one lane didn’t create any bottlenecks on the avenue. Peak-hour traffic counted on Prospect Park West at Carroll Street rose 5% in the morning (from 1,055 to 1,109 vehicles) and 2% in the evening (from 991 to 1,010 vehicles), the same pattern recorded. Weekday commute times remained the same; vehicle and cyclist counts indicated an increase of 13% in the morning and 9% in the evening. The situation was much different when it came to cycling. Weekday cycling between 3rd and 5th Streets rose 190%, but that figure came from comparing the average of four counts taken from August to November 2010 with a single count from June 2009. Sidewalk cycling volume decreased from 46% to 3%.
Citywide data gives context, not a second count
Making Safer Streets, a separate report from the same agency, published in November 2013, compared crash data before and after street projects completed over seven years. There were drops in injury crashes, ranging between 12% and 88% for different streets with different designs based on three years of before data versus two to three years of after data. Among the projects listed, Bowne Street in Queens, which saw a three-to-two-lane design and safety islands for pedestrians, saw a 23% reduction in injury crashes. Prospect Park West is not in this list, thus making this report an excellent context for the park, rather than an analysis for the project. On having fewer lanes, the report argues that a street with many vague lanes may be congested by vehicles, engaging in double parking and turning movements in the lanes intended for through movement, hence the need to give the movement its place. On cycling, the report noted a 72% drop since 2000 in the average risk of serious injury to cyclists in the city, while bike trips nearly tripled. The report added that the biggest crash reductions generally came where redesigns were most extensive and problems were worst.
Next Story